Archive for July, 2009

Cheese Window of Engagement

Friday, July 31st, 2009

Cheese Window of Engagement: Saxelby Cheesemongers in Essex St Market

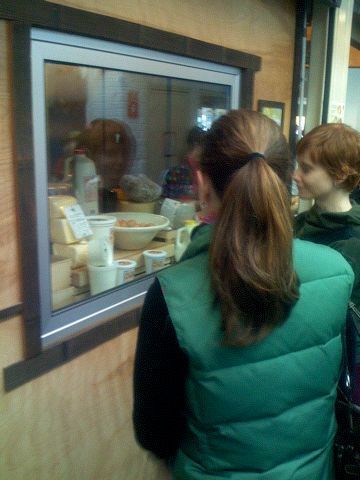
I look to the retail in the physical world in stores and markets for inspiration on how to better engage customers. This photo of two people in front of what I call the “Window of Cheese Engagement” at Saxelby’s in Essex St Market, NYC is a source of inspiration. I talked about what is going on in this photo during my Placemaking and IA talk at the IA Summit in Miami in 2008. It still awes me, and so I wanted to expand on those thoughts.

There is an incredibly rich level of engagement going on here. The two women are looking at cheese the main product that Saxelby’s sells in addition to milk, butter, eggs and yogurt. The product is close to eye level, it is in a setting (not a product alone by itself), it is well lighted, it is even treated as if in a picture frame. The two women at do more than just looking at the products together, they can talk to each other and with the reflection in the glass even maintain some eye contact if not at least situational/peripheral awareness of what the other woman is looking at and what her facial reaction and body language is. WOW! That is so much more being done than we right now struggle with in the online spaces. They do such an great job on supporting product, product placement and context, shopping as a social experience, co-shopping, and cross-selling.  The Window of Cheese Engagement falls into the category of a pilgrimage shopping ecology (though it even pulls in the milk category, which is usually fits into the utilitarian shopping ecology.

References
Shopping Ecologies Powerpoint
Shopping Ecologies Whitepaper
Placemaking Presentation done at Miami IA Summit 2008
Article on Saxelby’s The best Cheese Shop in NYC (New York)
Saxelby Cheesemongers Website

Office Of Elevators And Amusement Rides

Thursday, July 30th, 2009

What is a good/bad label? Is “Office Of Elevators And Amusement Rides” a good label?

Labeling is one of the major elements of user experience. When I was in South Carolina in an elevator in a hotel I looked and saw this sign posted. It threw me for a loop. Perhaps it was going to be a safe ride, but am I going to be turned upside down in the middle? Why were these two departments of Elevators and Amusement Rides together? Perhaps they were located in the same room. And I guess I can kind of see the logic, but it didn’t make me feel safer than if it was ONLY the Office of Elevators. No matter the logic that drove the initial naming convention, context matters, and most people are going to encounter this label while they are RIDING in an elevator.

References
Another blogger on the topic of Elevators and Amusement Rides
SC Office of Elevators & Amusement Rides Website

Tips for Better Bodystorming

Wednesday, July 29th, 2009

9 Tips for Better Bodystorming
Last weekend at Overlap09, the fourth Overlap, we did a Bodystorming exercise. Dave Gray, the organizer of Overlap09 asked me to talk about my work on Bodystorming. Dave Gray characterized Bodystorming perfectly as sketching not with a pencil and paper, but with our bodies. As the Bodystorm teams (of super thinkers/doers) went through the exercise I realized it would have been better to have had a list of tips that you can use for better bodystorming. Here is that list and some observations/learnings as well.

  1. Bodystorm groups over five people are fine, even up to 8 people worked well.
  2. Everyone needs to have a role, even if it is a prop.
  3. Freely use large cards that label who the different people are playing (Barista, CNN news feed, Dr).
  4. Use thought-bubble cards to show what an actor is thinking versus what they are saying. “Good morning to you, How can I help you?” while someone holds a thought-bubble card above their head that shows they are really thinking “A–hole.”
  5. Have a narrator, or color commentator that explains things to the crowd. That keeps the meta-talk to a minimum.
  6. The narrator can pretend it is like watching  TV and use a TV controller, to stop action, rewind, or fast forward.
  7. Your props can have feelings, thoughts, and they can talk.
  8. When your group is working through its presentation, try to approach it with the spirit of improv’s “Yes, and . . . ” rather than “No, but . . . “
  9. Bodystorm teams that did two skits showing a before and after were very effective.

Bodystorming References
Bodystorming Resources

Overlap09 Poster

Tuesday, July 28th, 2009

On my long plane ride back from overlap09 I drew this poster of the people, thoughts, activities, and feelings I had. It was just one of two Overlaps I have been able to attend, but it energizes me so much and changes how I think, I just had to make something right away to express it.

Dave Gray was our facilitator. He did an awesome job. Thank you Dave!

The Top Ten Mistakes UX (User Experience) Leaders Make

Friday, July 24th, 2009

Top 10 Mistakes UX leaders make

1. Not having a clear understandable process. UX leaders need to build process so new talent can learn and so outsiders can understand UXs value. And even more than just understand, so outsiders can collaborate and participate with the UX team.
2. Putting process before place. UX leaders need to make sure the right tools, supplies, and places to do UX work are available or else no amount of process will save you.
3. Using Usabilty Testing as design arbitrar whenever there are disagreements. Simple A/B testing is not going to take you to the next level.
4. Not playing nicely with Prodct/Project Management.
5. Managing documentation rather than design. We need to be concerned with behavior and impact.
6. Having more requirements documents than design briefs. Feature lists are no substitute for business strategy.
7. Focusing on implementation rather than evolution.
8. Not building unity of purpose both within and outside of your department.
9. Not timeboxing both divergent activities (idea generating) AND convergent activities (decision making & consensus building)
10. Not having enough whiteboards for both group use and individuals. See mistake #2.

Experience Diagram: Sustainability Day in life

Thursday, July 23rd, 2009

Here is example of an experience diagram. This is a day in a life that focused around sustainability. I did it and it’s about my Monday through Friday daily cycle. I did it at a workshop last year put on by Uday of Sonic Rim.

Things to notice:
The use of pictures and words. Hand rendered and preproduced images. Preproduced images allow for easier comparison between different people’s day in life. A line goes across the page showing begining to end of day.

3 New Ways to Measure/Evaluate UX (User Experience)

Wednesday, July 22nd, 2009

Three New Ways to Measure and Evaluate Your UX (User Experience).

I know you all are reading your omniture, webtrends, or google analytics for insights into your UX. I love inventing new methods to see, so here are 3 new and practical ways to measure or evaluate your UX.

A/B/C Testing
Do A/B/C (side-by-side-by-side) testing with people (individual or focus group) showing them your site and two other sites. Ask them what which two are more similar (on different topics) and why. Why? With 3 items, people can identify patterns and you get more variety of mashups, but it’s not too much variety that is overwhelming to them.

Social Media Expectations Test
Don’t look at your website. Find, collect and read all the social media (twitter, blogs, etc) for the last month that talks about your website. Imagine yourself as someone who has not yet been to your website, what could they know and what are their expectations about your site by just reading the social media. Then do this with two of your competitors and compare.

UX Horizon Test
With people experienced with your site and comparative sites get a list of 6 websites (or offline expeirences.) Tten take a piece of paper and draw a horizon across it (yes, its just a line going across from one side to another, perhaps give it a little curvature of earth to it.) Draw a stick figure representing themselves right at the bottom. Then have them place the websites or experiences in the 3D environment in relation to the stick figure based on personal relevancy.

So, in the next week or so I suggest you play around with one of these new measures of your UX.  If you start to want to get in-depth with the analysis of your results feel free to contact me if you need any help.

Reference
Definition of UX: How people interact and feel about an experience.

My earlier post on “How do you measure UX” was more broad and this post is more practical.

How do you measure UX (User Experience)?

Monday, July 20th, 2009

How do you measure UX (User Experience)?

This is a more thinking/theory post. For a more doing/practical post see “3 New Ways to Measure and Evaluate UX

A good question from Austin Govella, he asked me to blog on it. He and Livia Labate has been pursuing this question at UX Healthcheck. I myself have many thoughts on this question and this post is one thought about how I approach measuring UX for both online and offline experiences. This specifically relates to the UX Value of “Measure the Impact” in the UX Value Mandala.

For a given setting there is a reality, people have experience as they live and work in a particular reality. These people then create or make expressions of their experiences they have in these realities.

Why is it so complicated, can’t we just measure experience?
I am not interested in a reality if no one is experiencing it.
Different people can be in the same reality and yet have different experiences, for example they bring to a reality different expectations and different past experiences. A person’s “experience” is a contstruct and reflection on what happened to them.

Because we are seeking to understand what a certain set of activities or events MEAN to someone we can not just use objective measures of the experience that we collect as the experience unfolds. Too many UX measures soley focus on this one element of measuring UX.

In order to measure UX well we need to collect data on the setting of the experience and on people’s reflection and construction of their experiences.

How to analyze an experience setting.
The setting of an experience should focus on describing elements such as:
1) The actors, 2) their goals, and 3) feelings,
4) the different places, and 5) spaces, and 6) the objects located there,
7) during different events, 8) activities, and 9) acts that happen.

It’s more than just a task analysis.
I hope this expands most people’s conceptualization of user experience as only being made of activities or tasks.
Almost all the UX measurements out there seem to focus at the act and activity level. The better ones even correctly
coallese these into events that people experience, but few that I am aware of look at the other aspects of a experience setting.

Then the expressions that people have of the experience are varied and complicated.
Three good questions to explore are the following:
1 “Why or why not would you recommend this product or service to a friend?”
2 “If your experience with this product or service was a book, what would the chapters be titled?”
3 “What do you think you are going to start to do differently or continue to do the same now that you have had this experience?”

In other words, there are experience potential settings, there are the experiences that people have, and there are the memories/reflections of those experiences which they tell other people about and blog about. A good UX measurement index looks at all three.

Strategic Planning Process & User Experience (UX)

Sunday, July 19th, 2009

“How does UX fit into the strategic planning process?”

Strategic planning is planning for survival, even propsering. It is not leaving success to chance.

A straightforward view of Strategic Planning (at the business unit level) has 5 steps:
1 Mission & Objectives
2 Environmental Scanning
3 Strategy Formation
4 Strategy Implementation
5 Evaluation & Control

1 Mission & Objectives.
In the first step, the “UX Value Mandala” value of “See the Same” can help with finding ways of describing the company’s business vision. These visionary goals can be communicated in a customer centered way using many of the rendering methods of UX, such as story-boards, sceanrios, & personas. In addition, the “Mesure the Impact” UX Value means that the objective the business chooses here needs to be reflected in the online measurements and metrics.

2 Environmental Scanning
In the second step, the UX values of “Know the Small” and “Know the Large” can ehlp with a Michael Porter five forces evaluation on customers, both current customers in “Know the Small” and future customer and your competitions customers (conquests for you) in “Know the Large.” In addition, if a PEST analysis is done, then when you are looking at the social and technological factors you should involve UX team members and ask for their library of whitepapers. A good UX team that is living the value of “Know the Large,” will mean that they have a nice library of short whitepapers in which they have been continuely evaluating changes in the internet technologies and social media and how it might affect the business.

3 Strategy Formation.
In the third step, I don’t think there is much help that UX can add.

4 Strategy Implementatin
In the fourth step, I don’t think there i smuch help that UX can add.

5 Evaluation & Control
In the fifth step, the UX value of “Measure the Impact” can be a big help. If the same metrics the business chooses for overall success are the same ones that are being monitored online (which can give minute by minute feedback) is allows for better alignment and perhaps even act as an early warning system. Another help that UX might bring is to design a dashboard that would facilitate the monitoring and tracking of the actual performance versus the performance standards.

References
UX Value Mandala

Anthropology & UX Related Links

Thursday, July 2nd, 2009

Resources that are about anthropology and UX.

New Creative Order Emerges in Minneapolis – talks about

And a handful of younger shops with names such as Periscope and Olson that combine digital specialties with quirky offerings in design, packaging and even “social anthropology” are on the verge of lapping long-established, holding-company-backed agency brands in revenue.

Periscope – Check out their services page on Insight & Innovation, has ethnography. On their Talent section they have Heather Saucier, with background as Sociologist. Boo – no Business Anthropologist list.

Olson – Very light on the anthropology, but Social is there. No people listed at all, so no chance to see any anthropology background. It has a one sentence mention in their work section on Nike Bauer.

Out-of-the-box thinking is also being done in places such as Olson. The 180-person shop specializing in digital, for example, used a team of eight “social anthropologists” from places such as the London School of Economics to help Nike Bauer Hockey shake its perception as an older brand in a space dominated by youth. Olson mined hockey culture for insights into players’ language and aspirations — noting that youth hockey players are more influenced by older youth players than by the professional endorsers Nike typically employed. It also revamped the online retail experience. Bauer climbed to No. 1 from No. 3 in the category and has since been sold by Nike, which retained Olson to work on its Converse brand.

Ethnography and the Corporate Encounter: Reflections on Research in and of Corporations by Melissa Cefkin

Office Code: explores the impact of cultures upon office interaction and space planning

Mind the gap: ethnographers navigate the space between users and designers, start on page 40