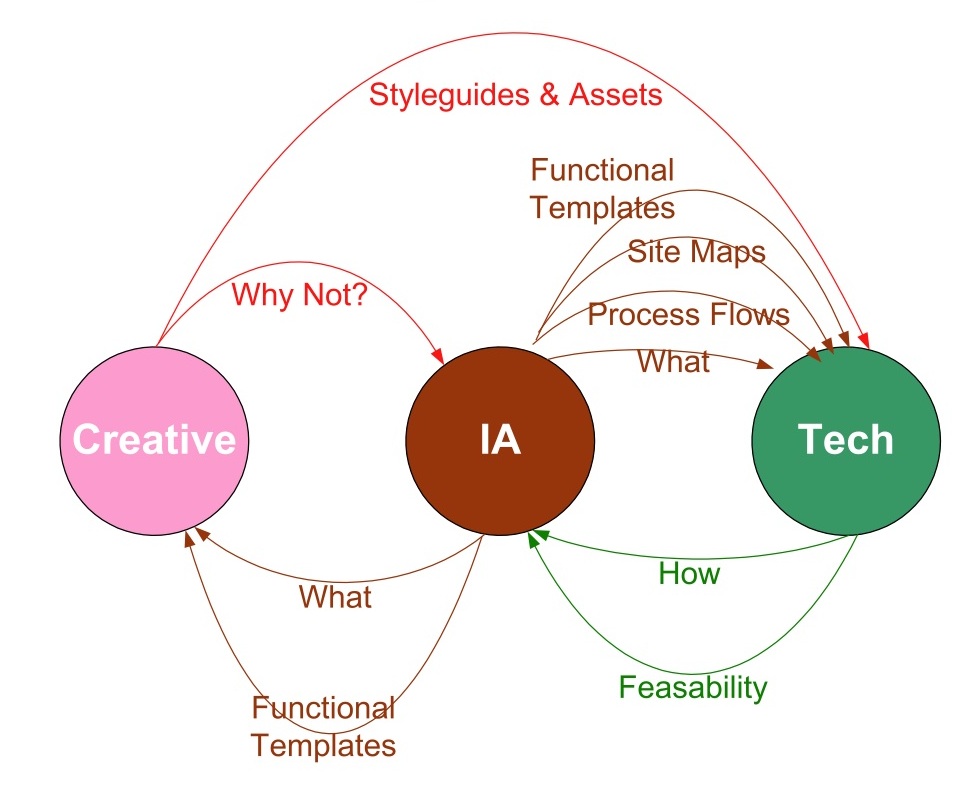
Here is an interesting diagram of the flows between three groups. Information Architecture, Technology or Engineering, and Creative. You can see flows of questions and asks and flows of answers and documents. The value of this diagram might be high for someone new to an organization to know what expectations are; expectations that other groups will have of them and expectations that they can have of other groups.

I like the more esoteric flows in the diagram more so than the actual work products. I think those conceptual flows of information are harder for groups to understand how they contribute to the the overall method.
For example, I like the yin-yang clarity of the IA being a filter or arbitrator that cycles the “why not?” from the creative team and the “how” from the tech team. It clearly shows (my interpretation) that the creative team should be responsible for trying to push the envelope of innovation, while the IA determines if it is justified for the context, and they work with the tech team to evaluate feasibility and adherence to the original concept.
What other more conceptual processes would make sense here?